

Unlock Utility Rebates to Accelerate Your Energy Efficiency Sales UtilityGenius CRM Integration...
You already know UtilityGenius is great for finding specific utility program information - but what if you want to compare multiple utilities across states to optimize your projects and resources? Today, we’re introducing you to the Compare All Utilities feature, and explaining how you can use this table to perform more complex, cross-region analyses.
Where to Access
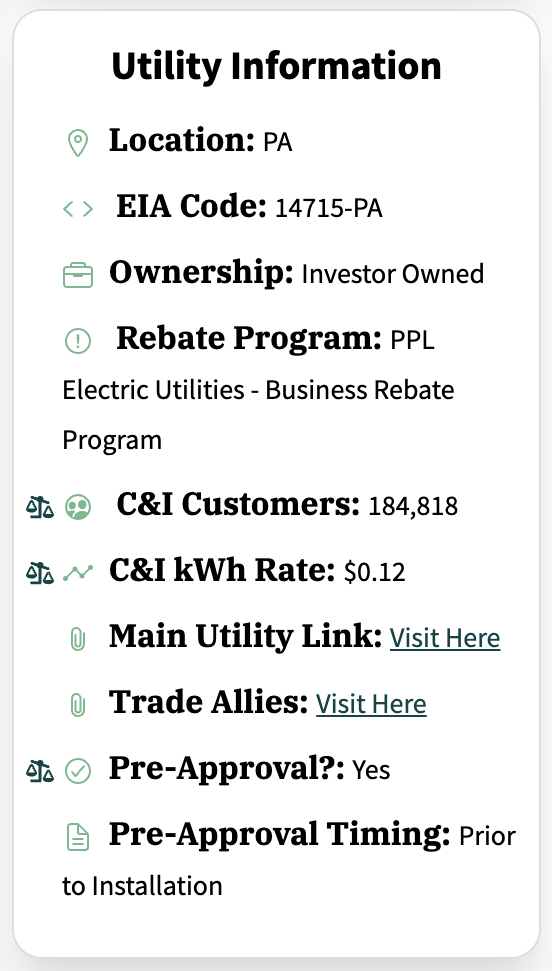
To launch Compare All Utilities, click the button on the home page, underneath the state selection dropdown. You can also find opportunities throughout the site to access this feature, including on the utility information panels - look for the scales to be redirected!
How to Use
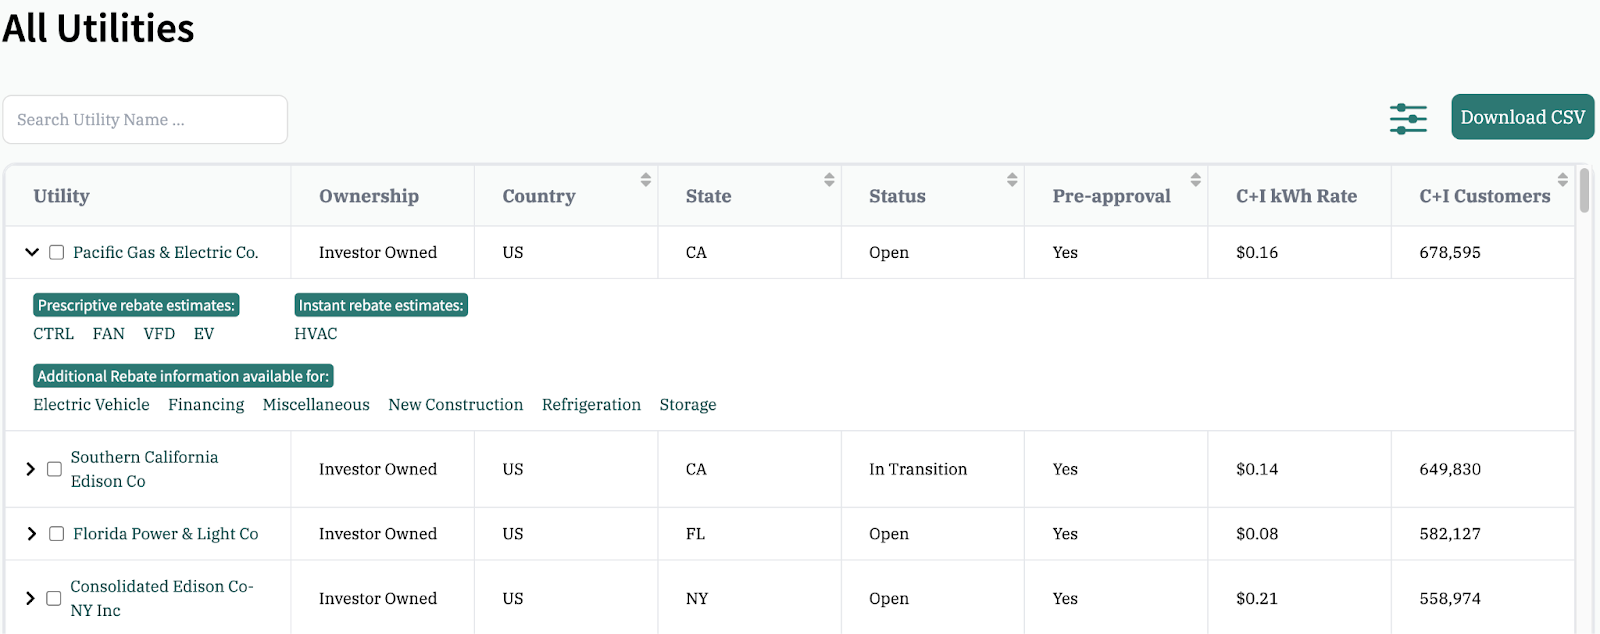
In simplest terms, the Compare All Utilities table is a chart containing information on rebate availability, market size, and location of all 3,000+ of the utilities we track in our database. Access to this table allows you to see utility information side-by-side and compare multiple program details at once. To see more information, click the arrow on the left-hand side of the program name to expand the selected program. This information is also available to download as a CSV for those who are looking for data to support more detailed analyses and reports.
A look at the Compare All Utilities table, with Pacific Gas & Electric expanded to show technology information.
Only want to compare certain programs? Our filtering capabilities allow you to select and view relevant cross-sections of our program data. Filter programs by rebatable technologies, location, program status, or pre-approval requirements.
You can get even more specific by selecting individual programs that you wish to see information for. Simply check the box next to the programs you want to see and hit compare to isolate them in the table. Select up to 500 programs at a time.
All filters will be maintained in the CSV download, carrying your work from UtilityGenius to your proposals and analyses. This level of customization makes the Compare feature invaluable to those working across territories.
Use Cases
With this much data and extensive filtering options, there are many ways to take advantage of this feature. If you need somewhere to get started, here are a couple of ideas to start with!
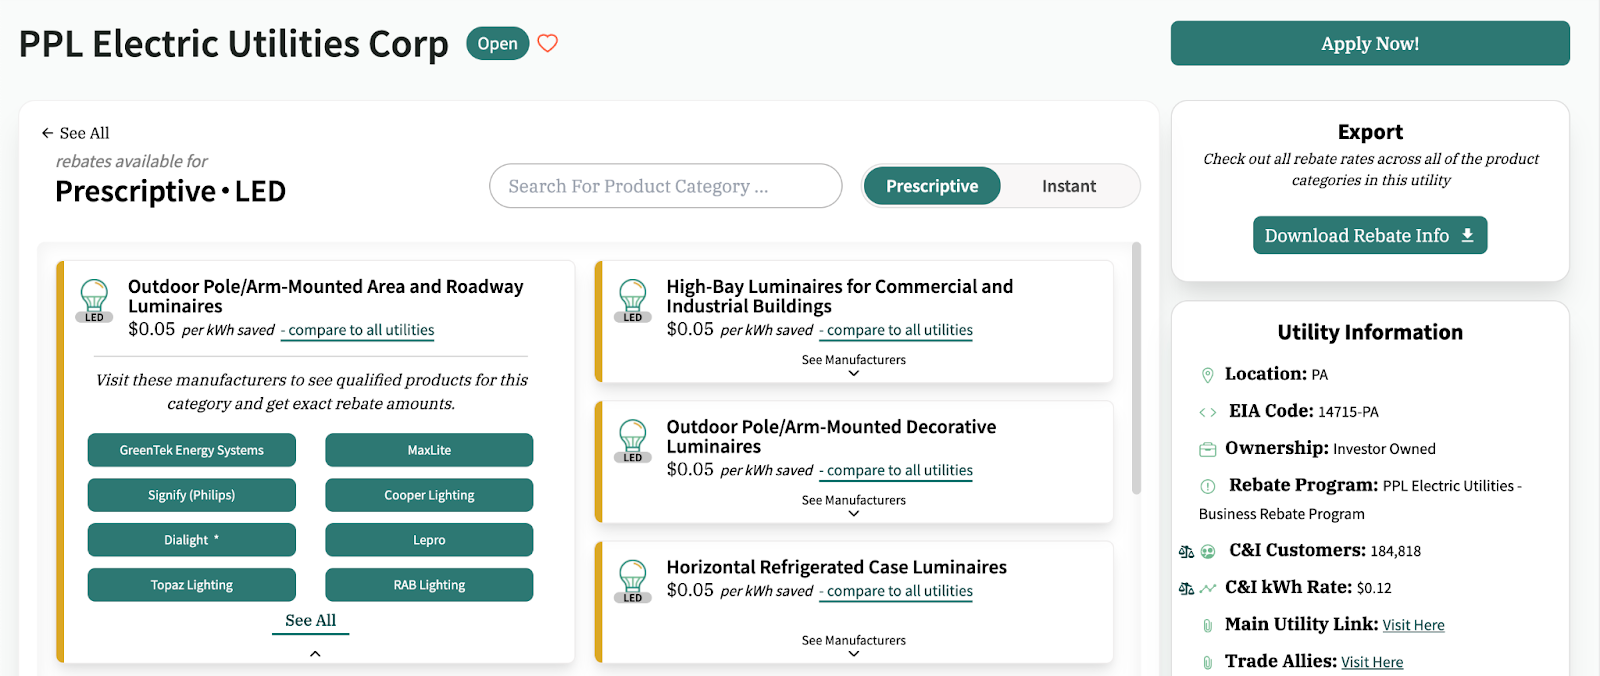
For those working across multiple locations, select only the utilities your properties are located in and see which technologies are incentivized. From this central hub, you can also visit individual utilities’ technology pages and see specific products and their rebates. Download a CSV containing all incentivized products for a utility for a convenient overview!
For regional or territory managers, use filters to select only the state that you’re interested in and see rebate information across those areas all at once versus going state by state. Need to identify the largest market size to allocate your efforts appropriately? Sort the data according to most C+I customers first!
To start using features like Compare All Utilities, download a full scope of rebate information for individual programs, and even more enhancements, upgrade to Pro now! Check out our Pricing page to learn more.
.svg)

.png?height=200&name=CRM%20Integration%20(3).png)
